Housing Market StatsHousing Prices November 10, 2018

Utah Housing Stats Q3 2018

The following analysis of select counties of the Utah real estate market is provided by Windermere Real Estate Chief Economist Matthew Gardner. We hope that this information may assist you with making better-informed real estate decisions. For further information about the housing market in your area, please don’t hesitate to contact your Windermere agent.


ECONOMIC OVERVIEW

According to the Labor Department, Utah has added 51,800 non-agricultural jobs over the past 12 months, representing a very solid growth rate of 3.5%, which makes Utah the fastest growing state in the country. For perspective, the U.S growth rate is running at 1.6%. Monthly employment gains in Utah have averaged 4,125 new jobs per month so far in 2018 and I believe we will end the calendar year having added more than 50,000 new jobs. In August, the state unemployment rate was 3.1%, down from 3.2% a year ago.


HOME SALES ACTIVITY

  • 9,589 homes sold during the third quarter of 2018, representing a drop of 5.7% from the same period in 2017.
  • Total sales activity rose in Wasatch County but dropped in the rest of the markets contained in this report.
  • Interestingly, and unlike almost all the Western states, listing activity continues to run at well below historical averages in Utah, which has been limiting the number of home sales. That said we saw a significant increase in the number of listings between the second and third quarters.
  • The supply of homes for sale appears to be rising, which could allow sales to increase. However, affordability issues may slow sales going forward even as we see more homes come onto market.


HOME PRICES

  • The average home price in the region continuedto rise in the third quarter, with a year-over-year increase of 8.6% to $368,654.
  • In addition to Wasatch County, just one county saw double-digit price increases when compared to a year ago; last quarter there were four.
  • Appreciation was strongest in Wasatch County, where home prices rose by a substantial 17.9%. Although this sounds extreme, it is a very small market and subject to major swings.
  • The takeaway from this data is that home prices, which have been appreciating at above-average rates for several years, are likely to see a slowdown as we move through the winter and into 2019.


DAYS ON MARKET

  • The average number of days it took to sell a home in Utah dropped five days compared to the third quarter of 2017.
  • Homes sold fastest in Davis and Weber Counties and slowest in Summit County. All counties, other than Salt Lake (+1), saw the days on market drop when compared to the third quarter of 2017.
  • During the third quarter of this year, it took an average of 38 days to sell a home in the region.
  • Housing demand remains quite robust, but the expected increase in inventory will give buyers more choice and less urgency. This could lead to market time rising.


CONCLUSIONS

This speedometer reflects the state of the region’s real estate market using housing inventory, price gains, home sales, interest rates, and larger economic factors.

For the third quarter of 2018, I have nudged the needle a little more in favor of buyers; however, we are far from being in a balanced market. Well-positioned and well-priced homes will still attract a lot of attention, but rising inventory and housing affordability are likely to act as modest headwinds to total sales and home price growth.


Mr. Gardner is the Chief Economist for Windermere Real Estate, specializing in residential market analysis, commercial/industrial market analysis, financial analysis, and land use and regional economics. He is the former Principal of Gardner Economics and has more than 30 years of professional experience both in the U.S. and U.K.

Housing Market StatsHousing Prices August 9, 2018

Utah Housing Stats Q2 2018

Gardner Report Q2 2018

Click the link to view the most current analysis of select counties of the Utah real estate market. Provided by Windermere Real Estate Chief Economist Matthew Gardner. This report is designed to offer insight into the realities of the housing market. Numbers alone do not always give an accurate picture of local economic conditions; therefore our goal is to provide an explanation of what the statistics mean and how they impact the Salt Lake housing economy.
Housing Market StatsHousing Prices May 24, 2018

Utah Housing Stats Q1 2018

The following analysis of select counties of the Utah real estate market is provided by Windermere Real Estate Chief Economist Matthew Gardner. We hope that this information may assist you with making better-informed real estate decisions. For further information about the housing market in your area, please don’t hesitate to contact me.

ECONOMIC OVERVIEW

According to the Labor Department, Utah added 46,200 non-agricultural jobs over the past 12 months, representing a very substantial growth rate of 3.1%. Although the area has experienced a slowing in employment gains, the economy is running at full employment, which limits how many new jobs can be created. In February, the unemployment rate was measured at 3.1%, down from 3.3% a year ago. I maintain my position that the regional economy will continue to outperform the country in terms of job growth and remain one of the most dynamic markets in the country.

HOME SALES ACTIVITY

  • There were 7,002 home sales during the first quarter of 2018, an increase of 3.2% from the same period in 2017.
  • Total sales activity rose in five of the counties analyzed in this report, with a solid increase of 11.6% in Weber County. Sales fell the most in Summit County, but this is a relatively small market so the drop is not a concern.
  • Listing activity continues to run at well below historic averages, with the average number of homes for sale in the first quarter down 39.8% from a year ago.
  • The lack of supply continues to put downward pressure on home sales.

HOME PRICES

  • The average home price in the region continues to rise with a year-over-year increase of 8.4% to $350,403.
  • Wasatch County experienced solid price growth. Average sale prices there rose by 46%, which is largely a function of it being a relatively small county. Interestingly, average sale prices fell in Summit County—again, due to its small market size.
  • Appreciation was strongest in Morgan County, where home prices rose by a substantial 76.4%. Although this may sound extreme, it is a very small market and subject to major swings. In this case, the average home price in January was $1 million which substantially skewed the numbers.
  • In aggregate, home prices continue to appreciate at above-average rates due to  supply limitations.

DAYS ON MARKET

  • The average number of days it took to sell a home dropped by 20 days when compared to the first quarter of 2017.
  • Sales occurred the fastest in Morgan and Davis Counties and slowest in Summit County, but all markets saw the length of time it took to sell a home either remain static or drop compared to the first quarter of 2017.
  • During the first quarter of this year, it took an average of 49 days to sell a home in the region.
  • The market remains robust, and well-priced homes are selling very quickly.

CONCLUSIONS

This speedometer reflects the state of the region’s housing market using housing inventory, price gains, home sales, interest rates, and larger economic factors. For the first quarter of 2018, I moved the needle a little more in favor of sellers. Unfortunately, I don’t believe we’ll see much improvement in listing activity in the coming months, which means sellers will continue to remain firmly in the driver’s seat.


Matthew Gardner is the Chief Economist for Windermere Real Estate, specializing in residential market analysis, commercial/industrial market analysis, financial analysis, and land use and regional economics. He is the former Principal of Gardner Economics and has more than 30 years of professional experience both in the U.S. and U.K.

Housing Market Stats February 8, 2018

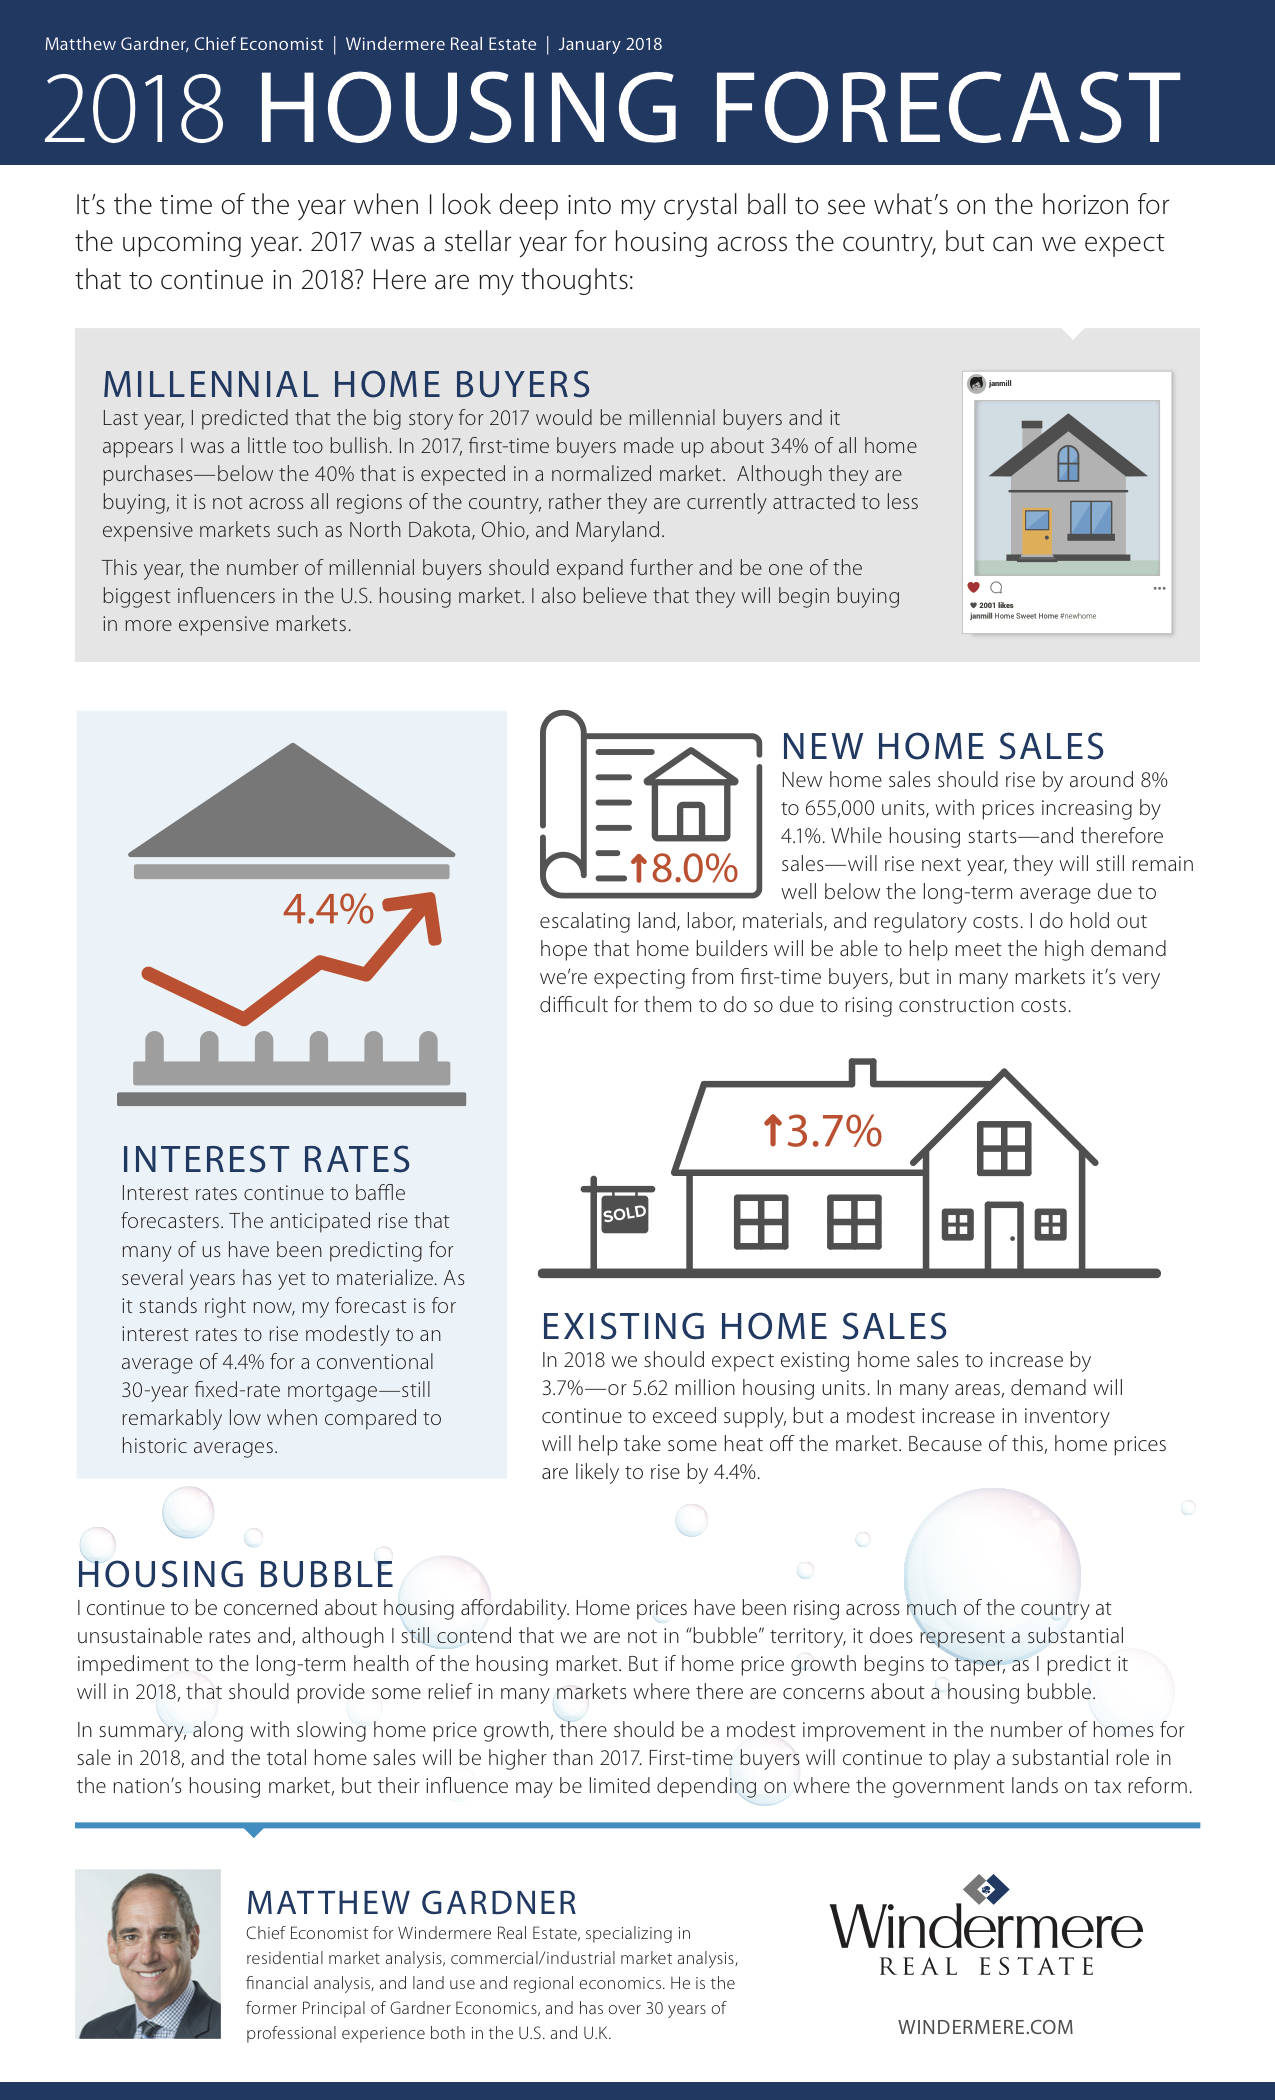
2018 National Housing Forecast

Housing Market StatsHousing Prices February 7, 2018

Utah Fourth Quarter 2017 – Housing Stats


ECONOMIC OVERVIEW

The State of Utah added 41,200 non-agricultural jobs over the past 12 months, representing a solid growth rate of 2.8%. Although the area has experienced a slowing in employment gains, the economy is running at full employment, which limits how many new jobs can be created. In last quarter’s report, I forecasted that the pace of employment growth was likely to kick back up during the last quarter of the year, but any substantial gains have, so far, failed to materialize; average monthly job growth is essentially static. That said, we are still waiting for December data and I believe that the final yearly number will be higher.

In November, the unemployment rate was 3.2%, matching the fourth quarter of 2016. With the unemployment rate leveling around 3%,  it is unsurprising to see wages rising. The annual rate of pay was up 2.8% over this time last year.


HOME SALES ACTIVITY

  • There were 8,529 home sales during the last quarter of 2017, a drop of 1.8% from the same period in 2016.
  • Similar to third quarter, sales rose in just two of the counties analyzed in this report: small Morgan County saw sales grow 50% year-over-year—it’s worth noting though that this equates to an increase of only eight units—and there were moderate sales increases in Utah County. Sales fell marginally in Salt Lake and Weber Counties, and a more substantial drop was seen in Wasatch and Davis Counties.
  • Home sales continue to be held back by very low levels of available inventory. Listing activity continues to trend at well below historic averages, with the total number of homes for sale in the fourth quarter down 33.7% from a year ago.
  • The takeaway from this report is that unless we see a drastic increase in listings, sales growth will continue to remain at below-average levels.


HOME PRICES

  •  Given the considerable competition for the few homes for sale in the fourth quarter, prices continue to rise at fairly rapid rates. Prices in the region were up 11.6% yearover-year to an average of $342,507.
  • Appreciation was strongest in Wasatch County, where home prices rose by 22%.
  • Substantial price growth was also seen in Summit, Salt Lake, Utah, and Weber Counties, where prices rose by doubledigit percentage points.
  • The imbalance between supply and demand persists, which means home prices continue to appreciate at aboveaverage rates. This is likely to continue  for the foreseeable future as inventory levels are unlikely to rise sufficiently to meet demand.


DAYS ON MARKET

  • The average number of days it took to sell a home rose by one day when compared to the fourth quarter of 2016.
  • It took an average of one month to  sell a home in Davis County. Sales were also brisk in Weber, Salt Lake, and  Utah Counties.
  • During the fourth quarter, it took an average of 50 days to sell a home in  the region.
  • I believe that the length of time it takes to sell a house will drop back down as we enter the traditionally active spring market. That said, sales will be limited by inventory constraints.


CONCLUSIONS

This speedometer reflects the state of the region’s housing market using housing inventory, price gains, home sales, interest rates, and larger economic factors. For the fourth quarter of 2017, I left the needle at the same point as third quarter. Supply issues persist and this continues to create competition for well-priced and well-located homes. The increase we’re seeing in the amount of time it takes to sell a home may suggest that the market is either getting weary of all the competition or buyers are delaying their purchase until there are more homes to choose from.


Matthew Gardner is the Chief Economist for Windermere Real Estate, specializing in residential market analysis, commercial/industrial market analysis, financial analysis, and land use and regional economics. He is the former Principal of Gardner Economics, and has more than 30 years of professional experience both in the U.S. and U.K.

Housing Market StatsHousing Prices November 16, 2017

Third Quarter 2017 Housing Update

The Gardner Report  | Utah Q3 2017

The following analysis of select areas of the Utah real estate market is provided by Windermere Real Estate Chief Economist Matthew Gardner. We hope that this information may assist you with making better-informed real estate decisions. For further information about the housing market in your area, please don’t hesitate to contact me.

ECONOMIC OVERVIEW


The State of Utah added 37,300 non-agricultural jobs over the past 12 months, a growth of 2.6%. Although this represents a slowing in employment gains, it is not a cause for concern because the economy is running at full employment and only so many new jobs can be created. That said, my latest forecast model is suggesting that the pace of employment growth is likely to kick back up during the last quarter of the year.

In August, the unemployment rate in the state was 3.5%, up from 3.3% a year ago. The increase in the unemployment rate is a function of a burgeoning labor force, which has risen by almost 56,000 over the past year.

HOME SALES ACTIVITY


  • There were 9,907 home sales during the third quarter of 2017, which was a drop of 5.3% from the same period in 2016.
  • Sales rose in just one of the counties analyzed in this report: small Morgan County saw sales grow 60% year-over-year. It’s worth noting though that this equates to an increase of just 18 units. There were more marginal sales increases in Summit and Wasatch Counties. Sales fell marginally in Davis and Utah Counties, with a more severe drop in Salt Lake County.
  • Home sales slowed due to very low levels of available inventory. Listing activity continues to trend at well below historic averages, with the total number of homes for sale in the third quarter 26.6% below the level seen a year ago.
  • The takeaway here is that unless we see a drastic increase in listings, sales growth will remain at below-average levels.
Annual Change in Home Sales

HOME PRICES


  • Because of considerable competition for the few available homes, prices continue to rise. Average prices in the region were up 10.2% year-over-year to an average of $340,031.
  • There was substantial price growth in Summit and Weber Counties, where prices rose by double digits. That said, all counties saw higher home prices in the third quarter than a year ago.
  • Appreciation was strongest in Morgan County, where prices rose by 32%.
  • There is clearly an ongoing imbalance between supply and demand, with home prices continuing to appreciate at above-average rates. This is likely to continue for the foreseeable future.
Heat Map
Annual Change in Home Sale Prices

DAYS ON MARKET


  • The average number of days it took to sell a home rose by five days when compared to the third quarter of 2016.
  • It took an average of less than a month to sell a home in Salt Lake, Davis, Utah, and Weber Counties.
  • During the third quarter, it took an average of 43 days to sell a home in the region.
  • Although demand remains robust, it appears as if buyers are being a little more “choosy,” which may be the reason why the time on market rose in four of the six counties in this report.
Average Days on Market

CONCLUSIONS


This speedometer reflects the state of the region’s housing market using housing inventory, price gains, home sales, interest rates, and larger economic factors.

In the third quarter of 2017, I have placed the needle well into seller territory. The supply of available homes remains at very low levels, which continues to create competition for well-priced and well-located homes. An increase in the time it takes to sell a home may suggest that the market is either getting weary of all the competition or that would-be buyers are possibly putting off buying until they see more choices in the number of homes for sale. All of that considered, it remains a seller’s market.

ABOUT MATTHEW GARDNER


Matthew Gardner is the Chief Economist for Windermere Real Estate, specializing in residential market analysis, commercial/industrial market analysis, financial analysis, and land use and regional economics. He is the former Principal of Gardner Economics, and has more than 30 years of professional experience both in the U.S. and U.K.
Moving Preparation July 12, 2017

Downloadable Moving Labels, Checklists & Worksheets

Moving Preparation July 12, 2017

How to pack for a move

While the home shopping process is fun, actually having to move your items to their new abode is less exciting. That’s why Landmark Home Warranty created a moving checklist that you can download here, our helpful guide on how to pack for a big move, and some free box labels and room planners you can print out yourself!

Making the move as easy as possible is a great goal and the more organized you are, the easier the move will be. You’ll also spend less on movers since most charge by the hour. Here is the best way to pack for a move and make sure you’re organized.

  1. Get the right supplies

Supply List download

Making sure you have the right supplies when you start to pack is vital. You won’t waste time going back and forth to the store to purchase things you need! Time is important, and you should start as early as possible. A few things you will definitely need as you begin packing:

– boxes

– bubble wrap

– padding

– paper (newspaper works well)

– packing tape and tape dispenser

– markers

– box labels (we have some for free later in this article.)

  1. Go room-by-room, packing the non-essential rooms first.

Pack what you don’t need first, such as holiday decorations, crafting or camping items, and so on. You can begin packing up more non-essential items from the bathroom and bedrooms – just make sure to keep the boxes organized!

  1. Organize your boxes by room and label them.

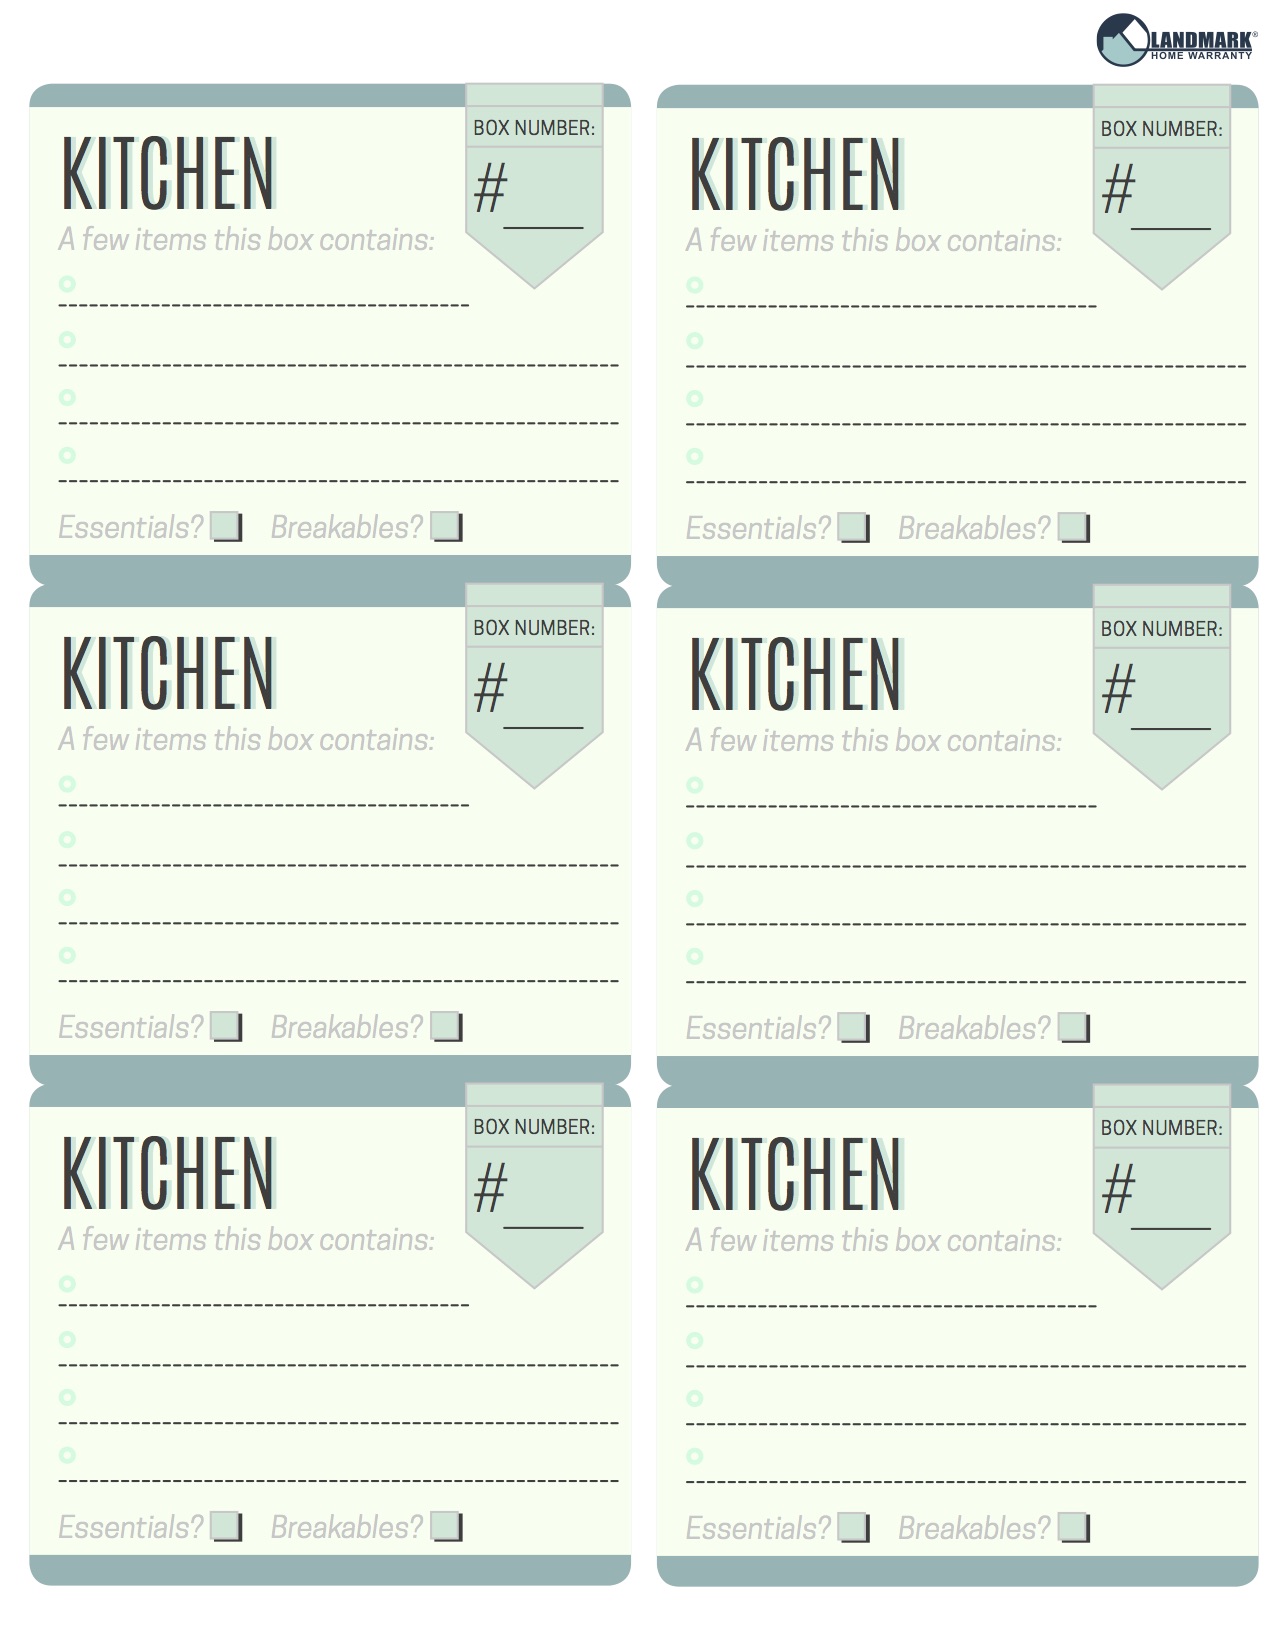
Moving Box Labels download

You might think that you’ll be able to remember what went in what box, but by the time they’ve been moved from your old home to the new home, it will be hard to recognize each box and what was inside of it. Use our labels, or design your own, to mark each box. Make sure you include what room it is going to in your new home, the box number (by numbering boxes you make sure none get lost), and a few of the items that are inside.

  1. Plan your rooms out ahead of time.

Knowing which of your boxes go into each room is important if you want the movers to put them in the right place on moving day. You also want to do the same thing with your furniture, although you might not want to label it.

To make sure you’re not hemming and hawing on moving day when your movers ask you where each piece of furniture goes in the new home, make a plan beforehand!

We have provided some easily printable worksheets that walk you through laying out where you want your furniture to end up in your new home. It’s easy to use! Just follow these steps:

  1. Download and print the worksheets.
  2. Decide the measurement for each square on the graph paper. (1 ft by 1 ft, for example, is the easiest.)
  3. Measure and draw a map of your room. (Stick to what each square should be. So, if your room is 16 ft by 11 ft, and you are using the 1 ft by 1 ft squares, that’s 16 squares by 11 squares!) Don’t forget to measure how big the doors are to know what furniture you’ll need to break down.
  4. Measure furniture among its length and width. (when in doubt, round up)
  5. Measure + draw the furniture that you will want in that room using the same measurement. (If your dresser is three feet by 1 foot, draw a dresser in the graph paper using 3 squares by 1 square.)
  6. Cut out the furniture squares and place them around the room until you get a good layout you like and that fits.
  7. Glue or tape the “furniture” where it should go in the room and give it to your movers.

Floor Plan Worksheet download

  1. Use clean clothes and laundry to wrap around breakables.

As you begin packing, make sure that you’re wrapping breakables with paper, or save time by wrapping clean clothes around breakables to save space. Make sure to pack plates vertically, like records.

  1. Use garbage bags to pack clothes, blankets, sheets, etc.

Boxes are helpful for stacking, but using garbage bags for softer non-breakable items can help provide protection between pieces of furniture during the move.

  1. Don’t pack air.

Don’t unload your dressers or drawers! Moving things into a box will just take up more room. Utilize the space you have and pack in your drawers, and using items you already have around your home, like suitcases, hampers, or baskets. (Just remember to label them, too!)

  1. Take photos of the back of the electronics.

That way, you’ll remember how different wires are connected.

  1. Use baggies to organize small parts.

Have baggies at the ready to tape onto bedframes, furniture, electronics, etc. that have small parts that shouldn’t be lost. (Make sure to mark what the parts go to on the bag just in case it gets separated.)

10. Pack an essentials box

Essentials Box download

Include things you’ll need as you’re getting settled in the home, and have it easily accessible. Some examples that you may want to include are:

  • Tool set (for putting furniture back together)
  • Toilet paper
  • Paper towels
  • Cleaning supplies
  • Dish sponge / soap
  • Paper plates / Plastic cutlery
  • Shower curtain
  • Toiletries
  • A clean outfit
  • Easy snacks or food

There you have it! That is the best way to move. Now, if you’re interested in getting a home warranty for your home, or getting deals on home services like home security, internet or television, go to Landmark Home Warranty

Not only will a home warranty with Landmark help save you money on repairs, replacements and internet and tv, it can protect your systems and appliances.

Housing Market Stats May 30, 2017

Latest Home Stats for Salt Lake County

Uncategorized November 18, 2016

9 Global trends that could affect our local real estate market

1_edited5Here are nine that might help you predict movement in your local market.

  1. Violence and other security issues are causing those in Ukraine, Turkey, and the Middle East to look outside of the region for a new home.
  2. Softer shifts, mostly due to political changes, are driving real estate investment out of the Philippines, Venezuela, Brazil, and Argentina.
  3. Vancouver is expecting a 10 percent drop in real estate sales next year due to a new 15 percent sales tax on foreign buyers.
  4. High unemployment was a major motivation for young people in Spain to look abroad, and now the same phenomenon is happening with young Greeks.
  5. The strength of the dollar means many Canadians might be looking to cash out on their vacation homes in the United States. The idea is that they’ll rent for the next few years and come back to buy again when the loonie is more competitive with its southern neighbor.
  6. One of the best ways to predict which countries are going to contribute most to your pool of foreign buyers is to see where tourists are coming from and take note when airlines add new direct flights from other countries to your area.
  7. Eco-tourism was a big driver for foreign visitors, but it’s waning. Next up might be “marijuana tourism” for U.S. states that have legalized the drug.
  8. Blackstone Group is selling a big portion of its investments in hotels and getting back into multifamily. You’ll see more hotel deals in 2017, but due to all the building happening now, an oversupply might lead to a cooling in 2018.
  9. Foreign investment focus may soon shift from New York and Los Angeles to smaller cities and towns that boast attractive events such as large wine, art, and film festivals.


Information courtesy of

Carla Rayman, CIPS, e-PRO, GRI

—Meg White, REALTOR® Magazine